Abstract
Nowadays we assist to a significant innovation of the teaching practises due to the crisis of the classical teaching approach, the availability of low cost mobile technology and the easy access to global knowledge and information. Learning Design systems represent valuable tools to support teachers in the delicate task of organizing the teaching-learning activities in active student-centered approaches. There are many active projects in this field, but the available tools do not always fulfill the expectations. Furthermore, there is a rapid growth of Web 2.0 apps to create digital artefacts with a strong potential impact in learning activities, but current LD platforms don’t guide teachers and students in choosing best apps to carry on a specific task. This paper provides an overview of the state of the art LD tools and developing perspective in this area.
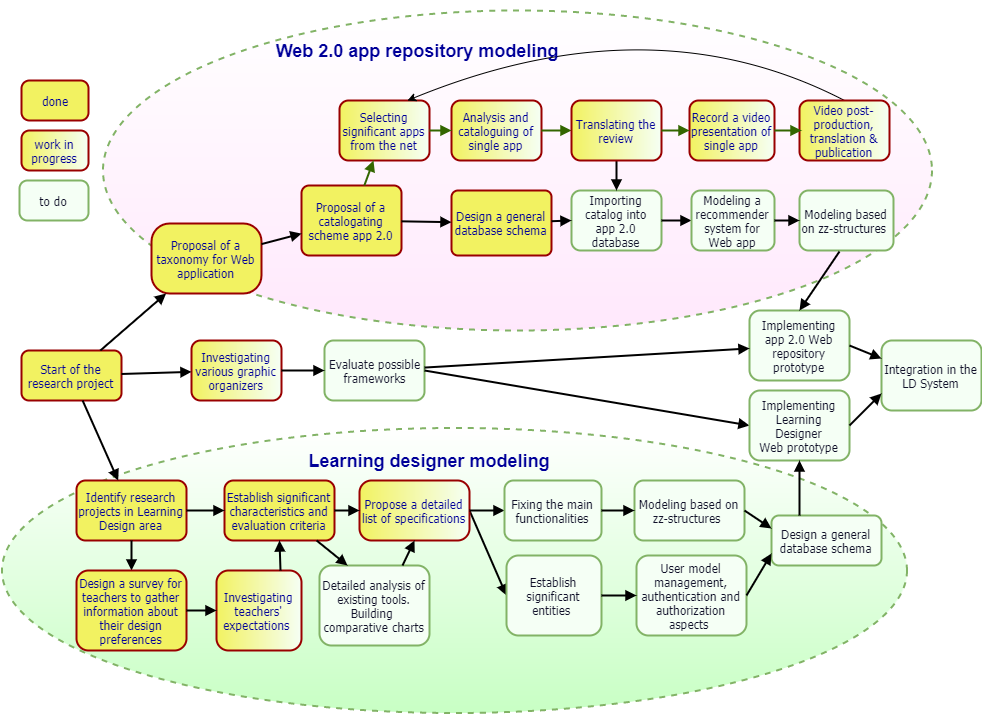
The current state of the project
The diagram of figure 2 shows the current progress of the reasearch project.
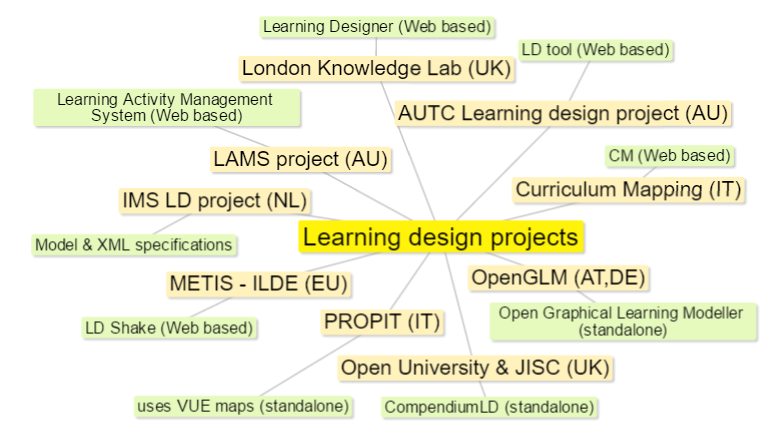
A partial map of research projects in the area of learning design
In an ideal scenario, learning design could be a useful artefact, an educational mediator that provides students with an overall view of their present and possible future, considering both their daily activities and their annual curricula. In addition to this, it could be useful for teachers to be guided in the choice of the best tools for specific activities and through any new methodology by the use of ready-to-use pedagogical templates. A good design tool should also be Web based, lightweight and simple to use to result actractive to teachers. There are many active projects in this field, but the available tools do not always fullfill the expectations: the map shows some tools developed by various research groups.
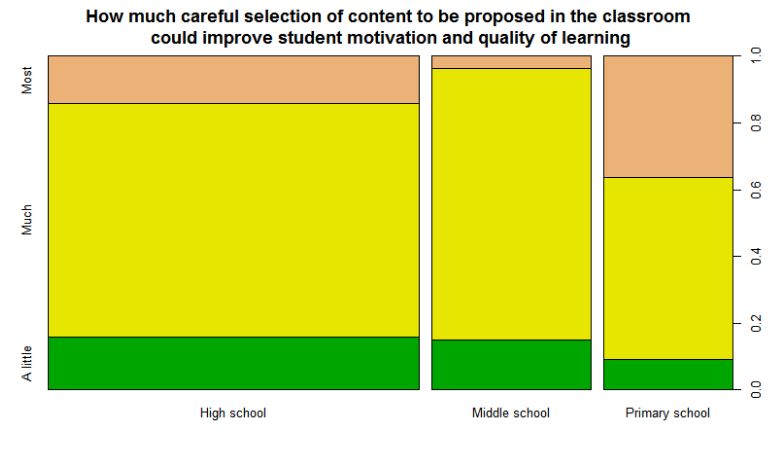
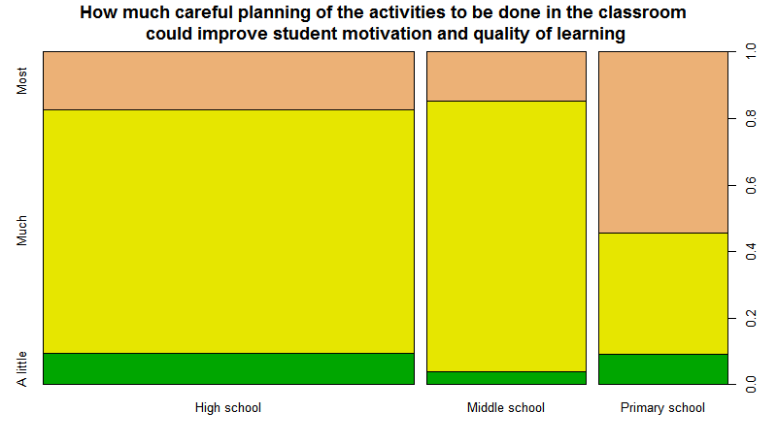
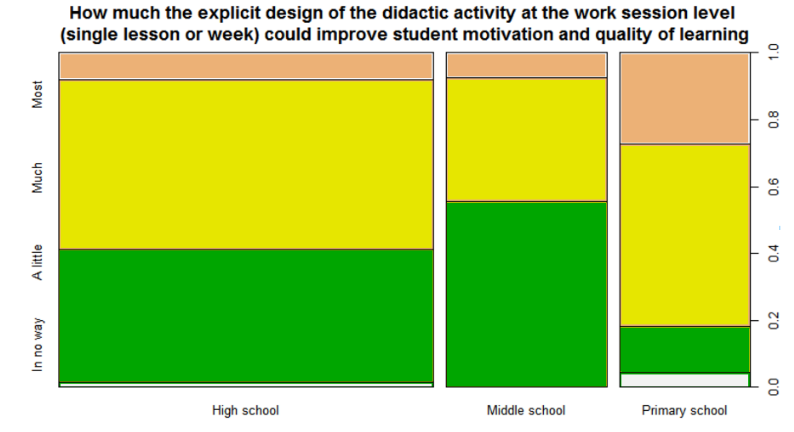
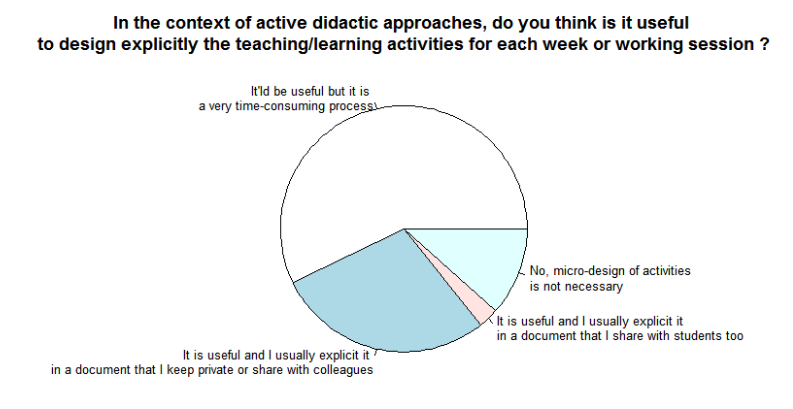
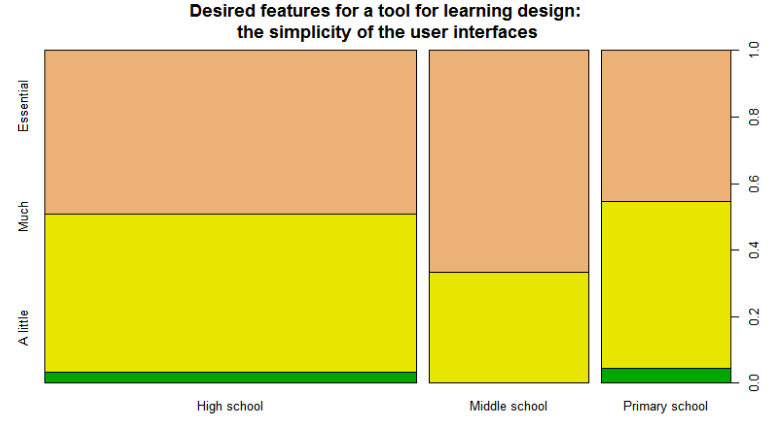
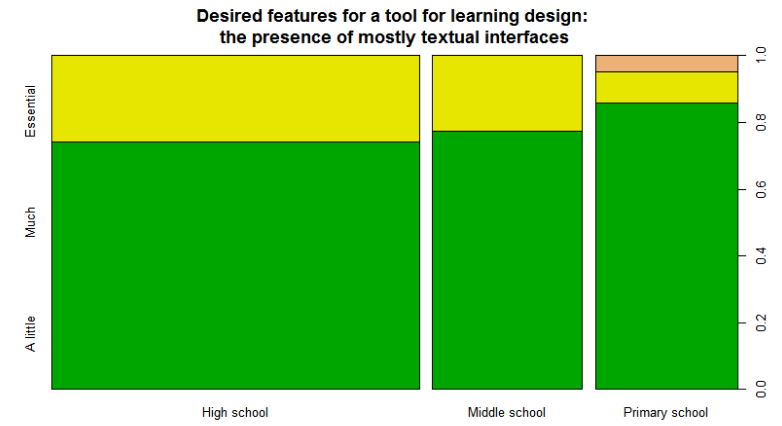
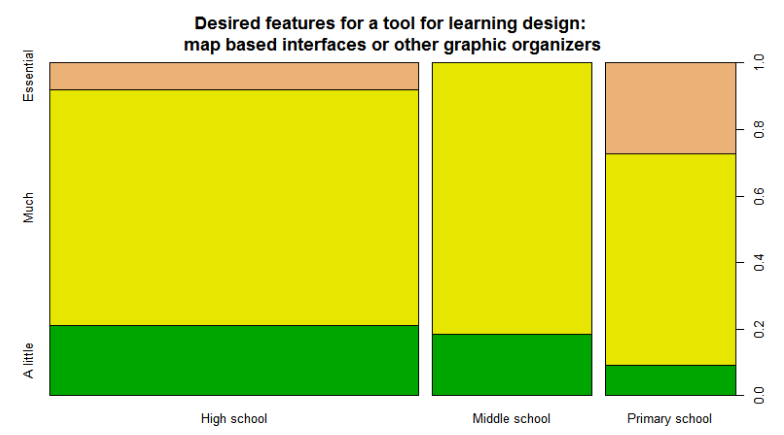
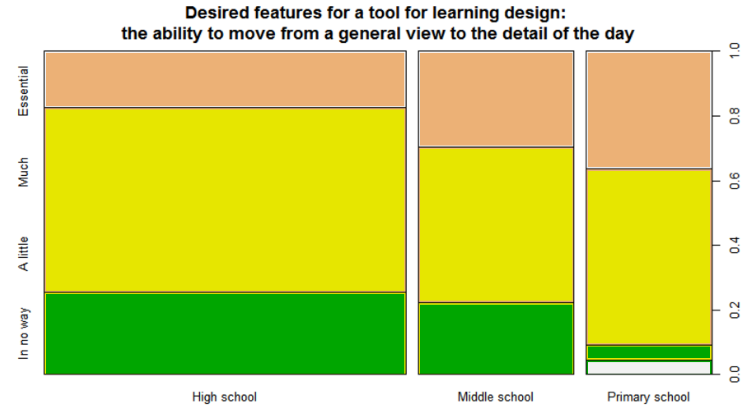
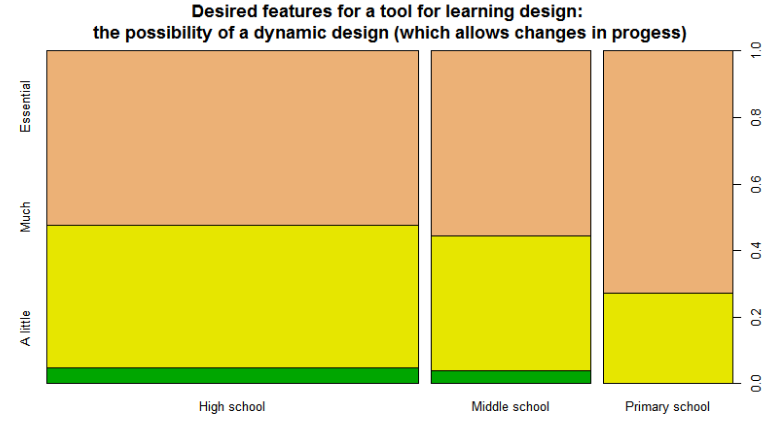
Investigating teachers' expectations
In order to understand the common learning design practices in Italian schools, a survey has been prepared and proposed to a sample of about 150 teachers from Friuli Venezia Giulia a north-east region of Italy. The questions in the survey has been grouped by following sections:
- general data;
- current learning design practices in schools;
- identification of criticalities in teacher's work;
- possible actions to improving quality of learnings;
- opinions and expectations from a Learning Design tool.
Some results, obtained from a preliminary dataset of 118 units, are visible in figure 4.
Learning Design specifications list
From a detailed analysis of the features of existing tools in the area of Learning Design and the survey’s answers collected from teachers, a list of desired characteristics for a Learning Design tool emerged:
- lightweight and adaptive Web hosted platform, compatible with mobile devices;
- cloud based hosting of the design artifacts to allow Web sharing and ubiquitous access;
- integration of both micro and macro views of learning paths;
- Web interfaces based on graphic organizers to provide clear and multiple perspectives;
- appropriate representation of the design to be shared with students;
- possibility to embed materials for each teaching / learning activity (TLA): attachment of documents, references to external resources, task instructions and challenge description for students;
- definition of skill lists to pursue in each session, useful to tag the TLAs;
- possibility to assign activities to groups and to collect students’ artefacts;
- supporting of widespread assessment approaches (process, product, self and peer assessments)
- pedagogical neutrality to support different teaching/learning approaches;
- complete support for a progressive design process;
- availability of pedagogical templates to facilitate the teachers’ initial work when experimenting specific methodologies;
- class and individual ePortfolio views to check progress in a specific learning scenario;
- integration of a recommender system that guides the teachers and students in the choice of the best Web 2.0 tools for a particular task;
- users’ preferences management and user modeling.
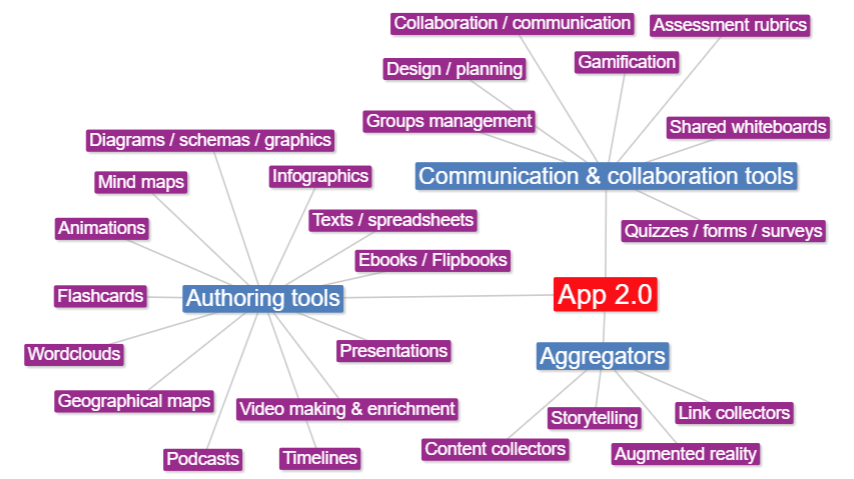
Proposed Taxonomy for Web applications
From a detailed analysis of about 120 Web applications we suggest an initial taxonomy which groups the applications in 3 categories: authoring tools, aggregators and communication/collaboration tools. At a lower granularity level, we identified 24 subcategories but the cataloging is still going on and the taxonomy will probably grow. It has been observed that many apps have a hybrid characterization so the relation between app and category is multiple.
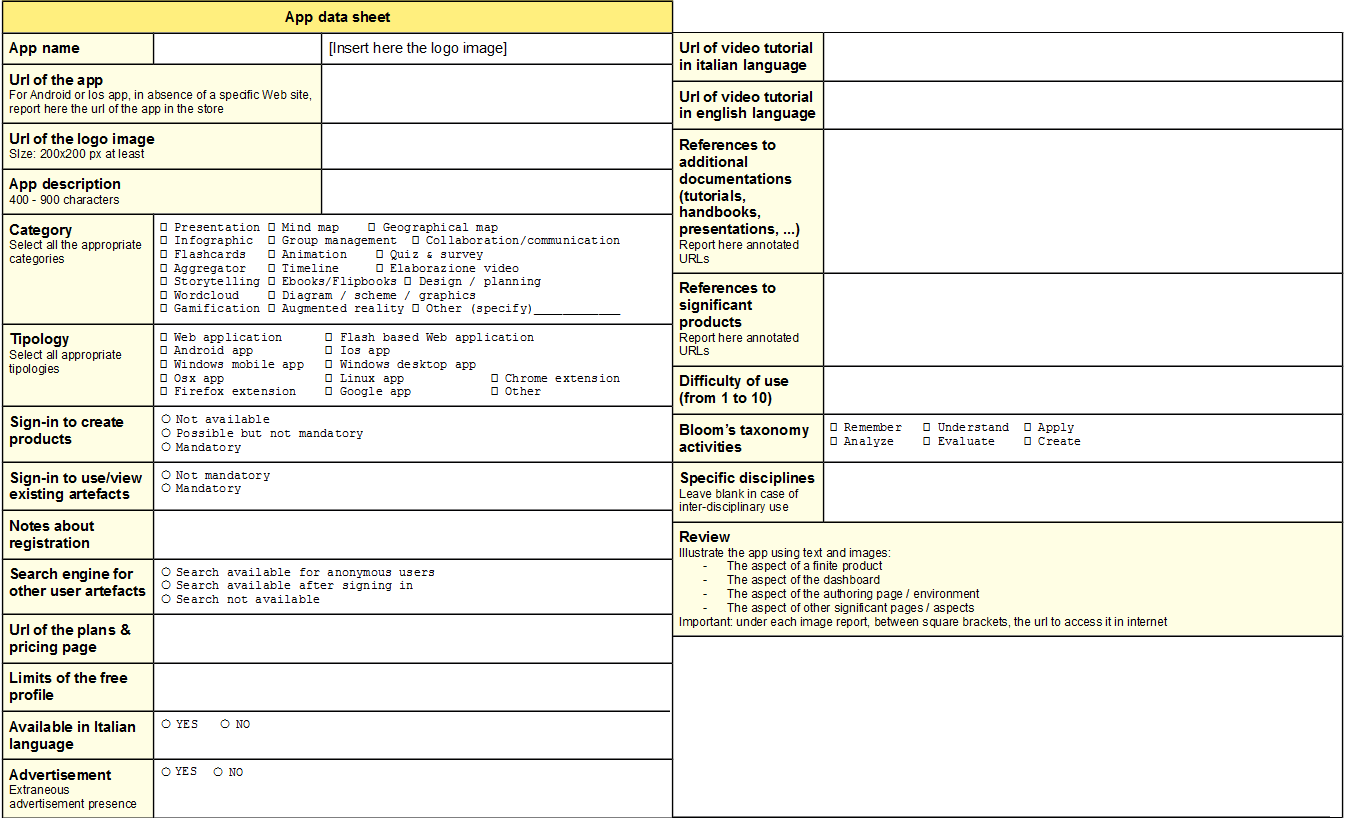
Proposed form to classify and review Web applications
To build a repository of Web 2.0 applications a set of significant characteristics has been identified in a cataloguing form. The review field illustrates the main sections of the app (home page, dashboard, authoring page, user profile, ...) and their functionalities.
App Inventory
111 Web 2.0 applications have been analysed and presented by short videos with the help of students of University of Udine. The videos are published in a dedicated playlist of the Sasweb lab.'s Youtube channel.
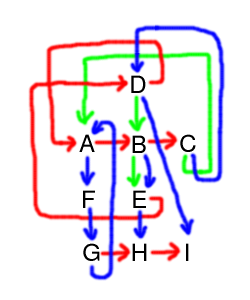
ZZ-Structures
Zzstructure is the generic name for Ted Nelson's ZigZag(tm), an original way of linking and organizing information. Zzstructures are one aspect of Nelson's vision of what hypertext should be. Zzstructures provide both data representation and exploring. In Zzstructure information is organized in multiple dimensions lists. Through the zz-views the user is always presented with a locally relevant view of the information, irrespective of how complex the structure is, and without losing the ability to navigate all the interconnections. In this project Zzstructures seem to be a promising approach to manage multilevel views in both Web 2.0 and learning design repositories.
Web 2.0 app recommender system
The repository of Web 2.0 applications will include hundreds of tools: most of these have a great potential to improve collaborative, cognitive and creative work, to build rich and attractive digital artefacts, to aggregate heterogeneous materials and to support workgroups. Their effective use of such apps in everyday working environments is still very limited because of the lack of knowledge about the variety of available tools. The aim of a recommender system here is to help the user to discover new Web 2.0 tools suitable for specific activities in a LD path and also as a stand-alone informative system to guide professionals, students, engineers, administrative workers and so on in the variety of Web applications. The recommender system will be initially based on content filtering to suggest items that are similar to those that a user used or liked in the past. A user model will be proposed to collect both implicit and explicit data (history of the user’s interaction with the repository, list of used applications, viewing times, the rate of single items, user preferences in proposed choices). Hybrid approaches will be also taken in account as soon as the amount of data collected from the community of users will be valuable.
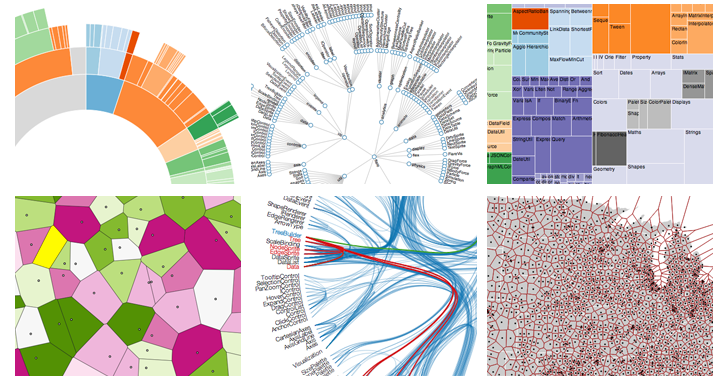
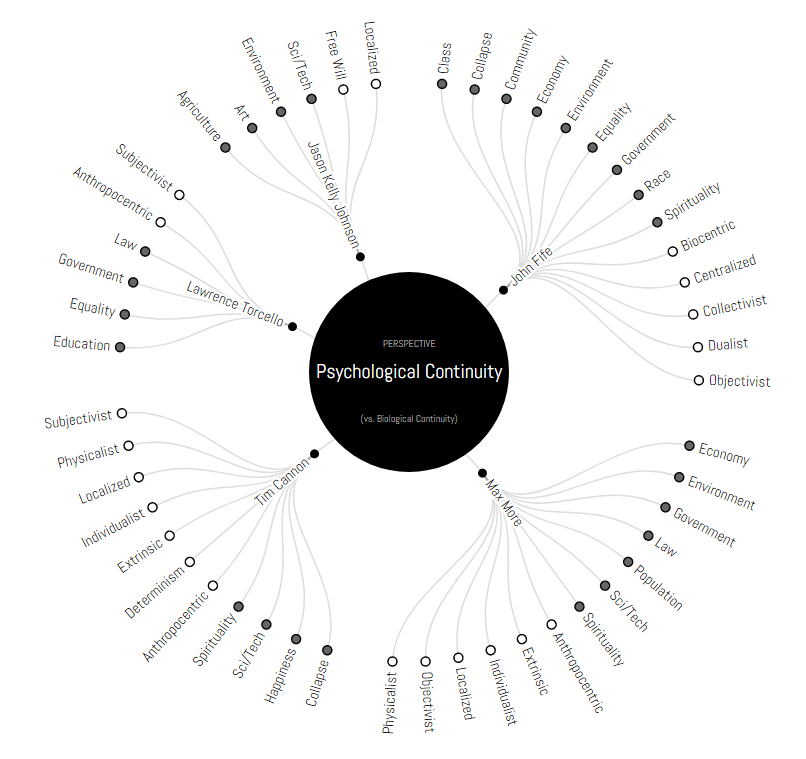
Visual driven interfaces
The choice of visual driven user interface is crucial to pursue usability and rich data navigation. There are many different graphic organizers to be taken into account in modeling user interfaces: for instance, hierarchic interactive representations like treemaps, radial trees, circle and sunburst partitions are useful to represent micro and macro scenarios and a collection of hierarchic resources. To express paths and relations it is possible to consider concept maps, Sankey and chord diagrams or narrative charts. For complex information, there are multivariate representations like graphs in different forms or radial charts. Many frameworks will be taken in account to create data driven interfaces, for example D3 data driven document library.